
Flucasting week 19: Predicting influenza severity
Throughout this flu season, KPWHRI's Dr. Mike Jackson, infectious disease researcher, will provide updates on his research team's experimental influenza predictor.
by Michael Jackson, PhD, MPH, Kaiser Permanente Washington Health Research Institute (KPWHRI) associate investigator
Current week's flu season flucast
Updated for the week of March 12, 2018
- In both Washington state and the U.S. as a whole, the peak of influenza A(H3N2) has passed, although some A(H3N2) viruses are still circulating.
- A second wave of influenza B viruses has also apparently peaked, with circulation of A(H1N1) and B viruses declining.
Please stay tuned—incoming observed flu data in future weeks may cause the Flucaster to change.
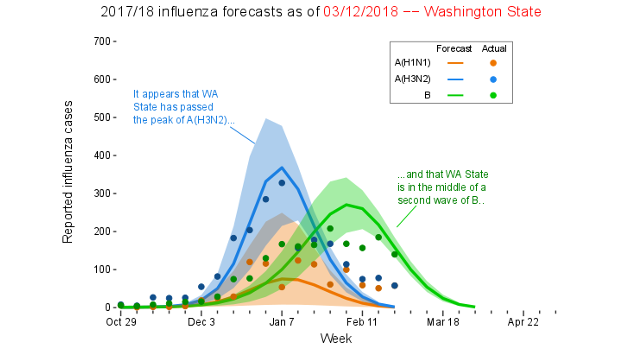
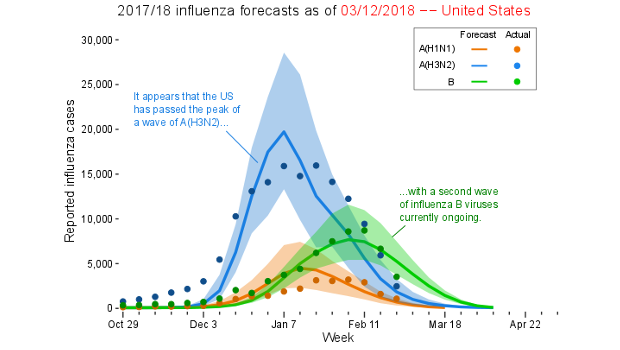
Legend: Lines on the graph show Flucaster model predictions about the progress of the 2017–2018 influenza season in Washington state (above) and the United States (below). Actual numbers of influenza cases will be added to the graphs as they are reported.
What is a Flucaster?
My research team at KPWHRI is developing the "Flucaster": a computer model to predict the intensity of an upcoming influenza season and the influenza strains that will dominate the season. We are also exploring whether our model can be used to predict the timing of influenza season, meaning when it starts, peaks, and ends. Our funding for this work is a 4-year, $1 million grant from the National Institute of Allergy and Infectious Diseases.
On this page, we will provide weekly Flucaster predictions about influenza season in Washington State and in the United States as a whole. We'll also provide current influenza surveillance data from the U.S. Centers for Disease Control and Prevention (CDC) and the Washington State Department of Health, to show how flu season is unfolding both in our state and nationally. Because infectious disease is notoriously hard to predict, our forecast will change over time based on incoming data.
Why 'flucasting' matters
Each year 9 million to 36 million Americans get the flu—and 12,000 to 50,000 die from it. In the United States, influenza typically circulates between November and April, but the severity and timing of flu season are different every year.
A reliable computer model that predicts when the number of cases will peak, and which influenza strains will circulate, would help hospitals and public health officials make proactive, preventive decisions. For example, hospitals and emergency departments could make sure they stock enough antiviral drugs to meet peak demand.
While such models have not yet been proven, researchers around the world are working on it, as we are. We hope you’ll check in regularly to see how we’re doing. And in the meantime, do all you can to stay healthy during flu season.
This web page has ongoing results from our experimental influenza forecasting model. The model is in early development and is still being tested. Information in this series should not be used to make clinical decisions. Our posts are a window into the future of flucasting with educated guesses about the coming weeks.
Past Flucaster weeks
Visit our recent news page to see our most recent Flucaster.
- Flucaster March 5, 2018
- Flucaster Feb. 28, 2018
- Flucaster Feb. 14, 2018
- Flucaster Feb. 7, 2018
- Flucaster Jan. 31, 2018
- Flucaster Jan. 24, 2018
- Flucaster Jan. 17, 2018
- Flucaster Jan. 10, 2018
- Flucaster Jan. 3, 2018
- Flucaster Dec. 27, 2017
- Flucaster Dec. 18, 2017
- Flucaster Dec. 11, 2017
- Flucaster Dec. 4, 2017
- Flucaster Nov. 27, 2017
- Flucaster Nov. 20, 2017
- Flucaster Nov. 13, 2017
- Flucaster Oct. 18, 2017
Get the flu vaccine

Flu shots boost your chances of staying well
While flu vaccine effectiveness varies year to year, it still makes sense to get immunized annually.
Read it in Live Healthy.