How epidemiologists predict the future of COVID-19
KPWHRI’s Dr. Michael Jackson describes how better testing will improve our ability to forecast the pandemic’s path.
By Michael L. Jackson, PhD, MPH, associate investigator at Kaiser Permanente Washington Health Research Institute
As an infectious-disease epidemiologist helping to guide Kaiser Permanente’s response to COVID-19, I was recently invited to talk to the Association of Washington Business—a statewide chamber of commerce. The members’ questions reflect what most of us are wondering: When can we re-open our businesses? What’s the timeline for economic recovery? How will we know when it’s safe to go back to work? These questions are challenging to answer.
Predicting a pandemic is a bit like predicting the weather. Both meteorologists and epidemiologists must rely on the scientific data and tools at hand to guess what’s going to happen next. And in the absence of data about this brand new virus, making accurate forecasts is difficult.
Broadly speaking, epidemiologists use two approaches. One is statistical forecasting, where we compare what’s happening in our area to what has happened in other parts of the world. It’s kind of like predicting tomorrow’s weather by looking at previous trends. Just as previous years’ weather patterns tell us what’s likely to happen this spring, experiences in Wuhan, China or the Lombardy region of Italy can tell us what’s likely to happen as the novel coronavirus moves through our state. These statistical forecasts can become more accurate over time as we gather more surveillance data from other countries and states.
The University of Washington’s Institute for Health Metrics and Evaluation has used this kind of statistical approach in their forecasts, which have received a lot of media attention recently. This method has proven to be fairly accurate over the short term, but unfortunately does not yet tell us what to expect when social distancing measures start to be lifted.
Forecasts change with better data
The second approach epidemiologists use is mechanistic forecasting. This involves trying to model the “mechanism” of the epidemic—the way the virus spreads through the population. In weather forecasting, meteorologists put likely ranges of temperature, precipitation, and windspeed into computer models to give us the probability of rain next week. Epidemiologists studying COVID-19 can do the same thing. We use data on people who have already been infected to try to learn the characteristics of the virus, such as how long sick people are contagious to others.
We then put these estimates into equations that model how quickly the virus spreads through the population. Running these equations into the future can predict how the epidemic will grow and what resources we’ll need, such as protective equipment and hospital capacity.
It’s challenging, of course, to estimate these values when we’re just now learning about the new virus and how it behaves. We must guess, for example, how long people will stay in the exposed category before they become infectious to other people.
The figure below shows an example of a mechanistic model of hospitalization that was created by a group called COVID ACT Now, which has partnered with some of the nation’s preeminent epidemiologists and data scientists to develop its U.S. Intervention Model.
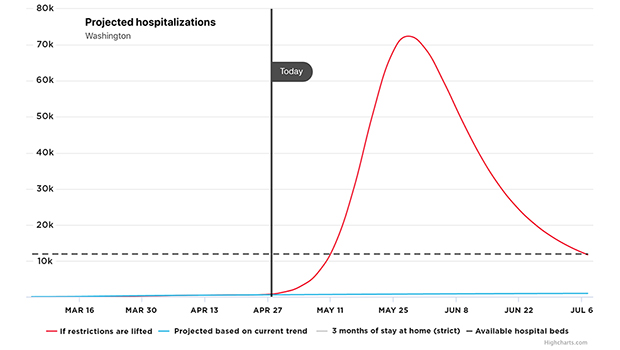
The advantage of the mechanistic model is that we can make different assumptions about what is going to happen by changing the values that we put into the equations. See, for example, its forecast for Washington state hospitalizations, with the latest data available as of April 23. Under our current “Stay Home, Stay Safe” control measures, hospitalizations will slowly increase but remain at manageable levels, as shown by the blue line in the figure. But if restrictions are lifted, we could see a remarkable spike that far exceeds the state’s hospital capacity, peaking around May 28, as the red line shows.
These predictions are not set in stone. They change over time as we gather better data to put into the model. With more studies and better testing, we will produce better estimates of infection rates and the effectiveness of interventions. Then we can rerun the equations to get more accurate predictions.
More information needed
One of the biggest questions before us right now is this: How can we can hold on to the benefits we’ve seen through various social-distancing measures and still be able to open businesses as much as possible? Our answer largely depends on what we learn about these two issues:
1. Is this new coronavirus seasonal? To answer this question, epidemiologists are carefully comparing how the virus is moving through the northern and southern hemispheres over the next few months. If we see that cases start to fall in the north while rising in the south, we’ll know that we’re likely to see a second and perhaps stronger wave of COVID-19 in the United States this fall.
2. How common are asymptomatic infections? In other words, how many people get COVID-19 but show no symptoms? We have preliminary estimates about this from small settings, and it ranges wildly from 20% to 50%. Getting better answers to this question will make a big difference in our predictions about issues such as how many people are still likely to become infected, how many might need hospitalization, and within what timeframe.
The best way to answer this question about asymptomatic infection is to have a reliable blood test that we can give to large groups, showing us who among our population has antibodies in their blood for this new virus. Once reliable tests are available that can be deployed on a large scale, we’ll have a far better picture of pandemic’s future.
In the meantime, we need to understand that COVID-19 is going to be around for a quite a while. We in Washington state have successfully flattened the curve of transmission through measures such as social distancing, hand washing, and wearing masks. Now we need to think about how to hold on these gains, structuring our interactions so that we can continue to protect ourselves and our communities.
director's note
Research versus COVID-19
From clinical trials to technical support, Dr. Rita Mangione-Smith describes how Kaiser Permanente Washington researchers are fighting the novel coronavirus.
healthy findings

Ask an epidemiologist: Where to learn about COVID-19
There’s much confusion about the new disease, but numbers don’t lie. The challenge is finding the right ones.
research
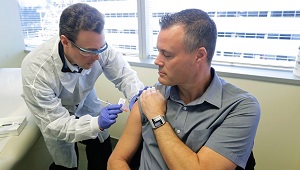
Coronavirus vaccine trial now includes older people
Led by Dr. Lisa A. Jackson, first-ever trial of any experimental vaccine candidate for COVID-19 virus has expanded.
vaccination